The Evolution of Automated Trading in 2026
The landscape of the foreign exchange market has undergone a significant transformation. As we move through 2026, the reliance on manual trading has diminished in favor of sophisticated automated systems. A forex robot performance comparison is no longer just a luxury for professional quants; it is a necessity for any retail or institutional trader looking to maintain a competitive edge. With the integration of advanced machine learning and real-time data processing, modern Expert Advisors (EAs) have become more adaptive, but they have also become more complex to evaluate.
Comparing these robots requires looking beyond simple ‘net profit’ figures. In an era where market volatility can spike due to geopolitical shifts or decentralized finance (DeFi) liquidity drains, understanding the nuances of how a robot behaves under stress is paramount. This guide provides a comprehensive framework for comparing forex robot performance, ensuring you can distinguish between a robust trading engine and a poorly coded ‘get-rich-quick’ script.
Key Metrics for Comparing Forex Robots
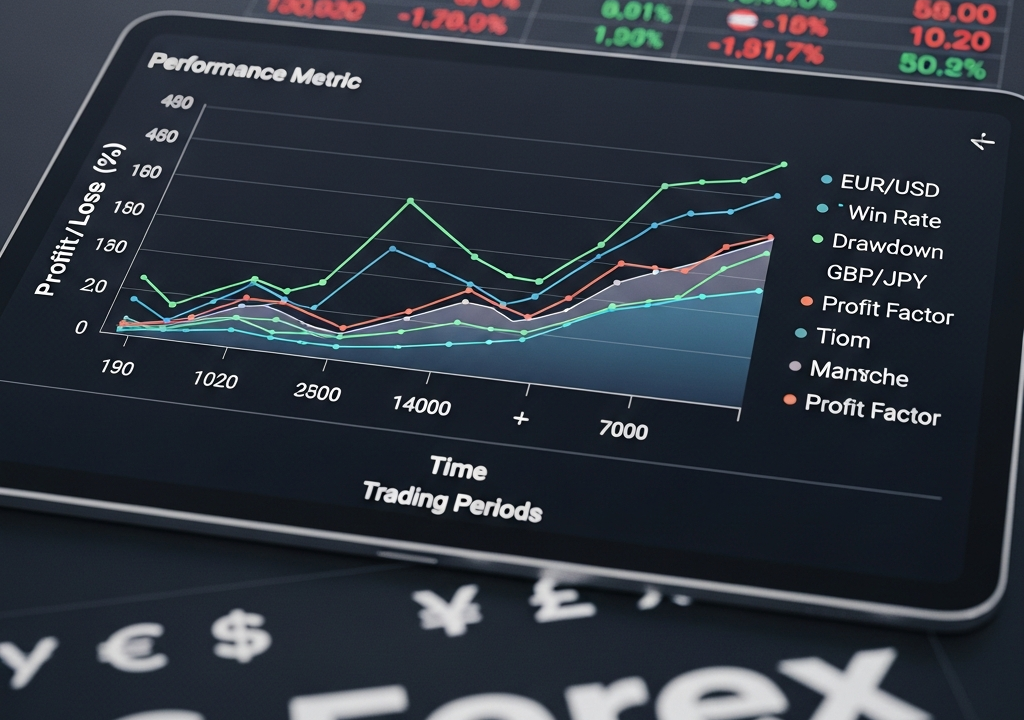
When you begin a forex robot performance comparison, you must look at a holistic set of data points. A robot that doubles an account in a month but has a 90% drawdown is statistically a ticking time bomb. To truly compare performance, we must focus on risk-adjusted returns.
Maximum Drawdown (MDD)
Maximum Drawdown is perhaps the most critical metric. it represents the largest peak-to-trough decline in an account’s equity. In 2026, high-frequency robots often aim for a drawdown of less than 15%. If you are comparing two robots where Robot A has a 50% annual return with a 10% drawdown, and Robot B has an 80% annual return with a 40% drawdown, Robot A is technically superior because of its higher ‘Pain-to-Gain’ ratio.
Profit Factor and Recovery Factor
The Profit Factor is the ratio of gross profits to gross losses. A profit factor above 1.5 is generally considered good, while anything above 2.0 is excellent. However, the Recovery Factor is equally important. This tells you how quickly a robot can recover from its maximum drawdown. A robot that takes two years to recover from a 20% loss is less desirable than one that recovers in two months.
Win Rate vs. Risk-to-Reward Ratio
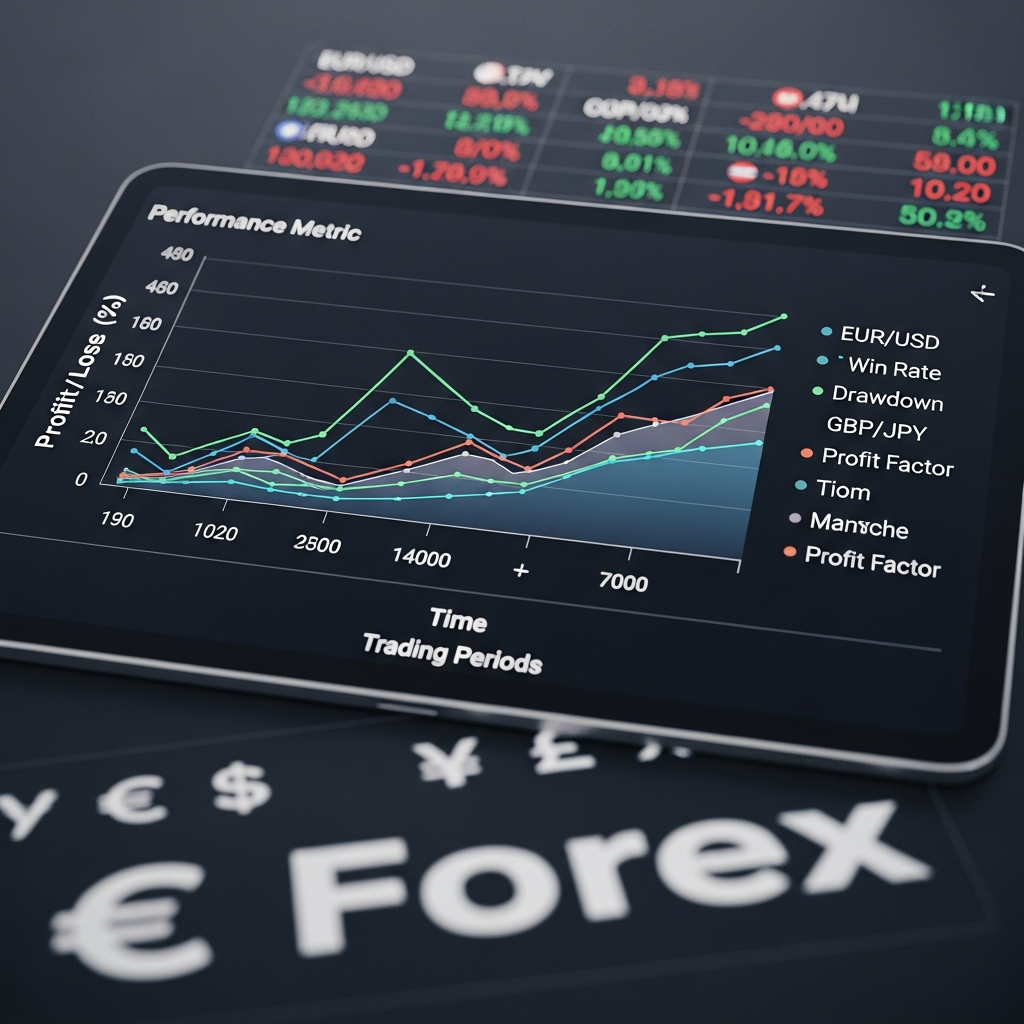
Many beginners fall into the trap of looking for high win rates. In the world of algorithmic trading, a 90% win rate often signals a ‘grid’ or ‘martingale’ strategy that avoids taking losses until they become catastrophic. Conversely, many institutional-grade trend followers may only win 30% of the time but have a risk-to-reward ratio of 1:5, making them incredibly profitable in the long run. When conducting your forex robot performance comparison, always pair the win rate with the average win/loss size.
Backtesting vs. Live Forward Testing in 2026
The biggest pitfall in the automated trading industry is the reliance on ‘cherry-picked’ backtests. In 2026, sophisticated backtesting software can simulate slippage, variable spreads, and even network latency, but even these cannot perfectly replicate live market conditions.
The Danger of Curve Fitting
Curve fitting occurs when a developer optimizes a robot’s parameters specifically to fit historical data. While the backtest looks like a perfect upward line, the robot fails immediately upon reaching the live market because it hasn’t learned to trade; it has merely memorized the past. A valid comparison must prioritize live ‘forward testing’ data from verified third-party sites like Myfxbook or FXBlue over several months.
Monte Carlo Simulations
Modern comparison tools now use Monte Carlo simulations. This involves running the robot’s strategy through thousands of randomized versions of historical data to see how often it fails. If a robot has a 95% ‘confidence level’ of not blowing the account, it is a much safer bet than a robot that only looks good on a single historical run.
Categorizing Robots by Strategy Type
You cannot compare a scalper to a swing trader; it is like comparing a sprinter to a marathon runner. A proper performance comparison must be done within the same category of strategy.
High-Frequency Scalpers
These robots aim for tiny profits on many trades, often holding positions for seconds or minutes. In 2026, these are highly dependent on low-latency connections and ECN brokers with zero spreads. When comparing scalpers, the most important metric is the ‘execution speed’ and ‘slippage tolerance.’
Grid and Martingale Systems
These systems add to losing positions in the hope of a reversal. While they produce very smooth equity curves, they carry the risk of a ‘black swan’ event wiping out the account. Comparison of these robots should focus on the ‘Maximum Open Lots’ and the equity-to-balance ratio during peak volatility.
Institutional Trend Followers
These robots use AI to identify long-term shifts in currency value. They are much more robust but require patience. When comparing these, look at the ‘Sharpe Ratio,’ which measures the consistency of returns relative to the risk taken.
The Influence of Broker Conditions on Performance
One factor often overlooked in a forex robot performance comparison is the broker environment. A robot might perform exceptionally well on a ‘Demo’ account or a specific ‘Zero Spread’ account but fail on a standard retail account. In 2026, the gap between institutional and retail liquidity has narrowed, but slippage remains a factor.
If you are comparing two robots, ensure the data is gathered from the same broker or at least the same type of execution (STP/ECN). A robot that relies on ‘Stop Orders’ will be much more sensitive to price gaps than one that uses ‘Market Orders’.
How to Conduct Your Own Forex Robot Performance Comparison
To find the best EA for your portfolio, follow this step-by-step methodology:
- Filter by Verified Data: Only consider robots with at least 6-12 months of live, third-party verified trading history. Ignore screenshots or ‘unverified’ MT4/MT5 statements.
- Analyze the Drawdown Period: Look at when the robot performed poorly. Was it during a period of high volatility (like a central bank announcement) or low volatility? This tells you the robot’s weakness.
- Check the Correlation: If you are running multiple robots, compare them to ensure they aren’t taking the same trades. If Robot A and Robot B both buy EUR/USD at the same time, you aren’t diversifying; you are just doubling your risk.
- Look at the ‘Trade Expectancy’: This is the average amount you can expect to win (or lose) on every trade. If the expectancy is too low (e.g., less than 2 pips), the commissions and spreads will eventually eat all your profits.
The Role of AI and Neural Networks in 2026
The current year, 2026, has seen a surge in ‘Neural Network’ EAs. Unlike traditional robots that follow fixed ‘If/Then’ rules, these robots use deep learning to adapt to changing market structures. When comparing these, the traditional metrics still apply, but you must also look at the ‘Training Period.’ A robot that hasn’t been updated or ‘retrained’ on recent 2026-2026 data may be using obsolete patterns.
However, be cautious. Many developers use ‘AI’ as a buzzword. A true AI robot will show a more varied trade distribution and won’t just trade the same time of day every day. It should demonstrate an ability to sit out of the market when conditions are unfavorable.
Common Red Flags in Performance Sheets
While performing your comparison, watch out for these deceptive practices:
- Hidden Trades: Some developers hide losing trades by not closing them, which keeps them off the ‘History’ tab while the equity continues to drop.
- Abnormal Balance Spikes: This often indicates that the developer deposited more funds to hide a massive drawdown.
- Extremely High Leverage: If a robot requires 1:500 or 1:1000 leverage to survive, it is likely over-leveraged and destined for a margin call.
Conclusion: Choosing the Right Robot for Your Profile
There is no such thing as the ‘best’ forex robot in a vacuum. The ‘best’ robot is the one whose performance metrics align with your personal risk tolerance. If you are a conservative investor, a trend follower with a 10% annual return and 3% drawdown is your winner. If you are looking for aggressive growth and understand the risks, a high-frequency scalper might be the choice.
A thorough forex robot performance comparison is the only shield you have against the marketing hype of the industry. By focusing on drawdown, recovery factors, and live verification, you can navigate the complex world of 2026 automated trading with confidence and build a sustainable, profitable portfolio.